If you are researching Burlingame top neighborhoods, two names keep rising to the top: Easton Addition and Burlingame Park. Both deliver tree-lined streets, easy access to shops and restaurants, and highly desirable schools, but they are very different markets once you start peeling back the data.
This guide compares supply, pricing, lot value, local rules, walkability, parks, and schools so you can quickly understand how each of the Burlingame top neighborhoods fits a particular lifestyle. I walk through practical numbers and local quirks you won’t find on a simple listing search.
Table of Contents
- Why Housing Supply Matters in Easton Addition vs Burlingame Park
- Lot Sizes and Building Potential: What You Actually Get
- Home Prices and Price Per Square Foot in Burlingame’s Top Neighborhoods
- Walkability, Shops, and the Burlingame Lifestyle Factor
- Parks, Tree-Lined Streets, and the Small Details Buyers Love
- Schools and Family Logistics in Burlingame
- Home Styles, Floor Plans, and Renovation Potential
- Which Burlingame Neighborhood Is Right for You?
- Key Terms and Numbers Every Burlingame Buyer Should Know
- Next Steps for Buying a Home in Burlingame
- FAQ
- Final thought
Why Housing Supply Matters in Easton Addition vs Burlingame Park
Supply is the single biggest driver of what you pay and how fast you need to move when buying in any of the Burlingame top neighborhoods. Easton Addition contains about 1,555 homes—roughly 25 percent of Burlingame’s housing stock—so turnover there is meaningful. Burlingame Park, by contrast, has only about 451 homes. That difference explains a lot.
A neighborhood with 1,500 homes will naturally see many more transactions per year than a neighborhood with fewer than 500 homes. In practical terms:
- Easton Addition saw roughly 56 sales in 2024 and is projected to finish 2025 with about 40 to 42 closed sales.
- Burlingame Park saw about 16 sales in 2024 and will likely have around a dozen sales in 2025.

The smaller the pool of inventory, the more likely prices are to hold—or climb—because buyers have fewer options. That is why the supply story is the first stop when comparing any of the Burlingame top neighborhoods.
Lot Sizes and Building Potential: What You Actually Get
Lot size and the ability to rebuild are central when evaluating value. In Easton Addition, lots are typically around 6,000 square feet. These are generous but standardized parcels that have become the default for many buyers who want the option to rebuild or significantly remodel.
Burlingame Park tends to have slightly larger lots on average—think 7,000 to 8,000 square feet in many pockets. That extra space shows up in backyard size, side-yard separation, and the feeling of openness along the street.
Lot value has moved significantly in recent years. A few years ago a 6,000 square foot rebuild lot in Easton Addition might trade in the low $2 millions. Recently we’ve seen lots in that same size range sell for $2.5 million to nearly $2.85 million. That jump has shifted resale and new build economics for both of the top Burlingame neighborhoods.
Historic rules change what you can build
One sharp difference between these two Burlingame top neighborhoods is regulatory. Burlingame Park has a historic designation. That means you cannot simply buy a house and tear it down for new construction without a review process. If a home is designated historic, you will likely need to preserve the facade and the way the house presents to the street.
Easton Addition does not have the same blanket historic restriction. You still must navigate the city’s design review and planning rules, but teardown-and-rebuild is a more accessible option in Easton Addition than in Burlingame Park. For buyers who want a clean new-build, that difference is often decisive.
Home Prices and Price Per Square Foot in Burlingame’s Top Neighborhoods
Numbers are blunt instruments, but they sharpen comparisons. For a recent 12-month window:
- Easton Addition: Median price around $3.678 million, average about $3.646 million, with average price per square foot roughly $1,474. Sales ranged from about $2.1 million up to $7.5 million.
- Burlingame Park: With a small sample (roughly a dozen sales), median landed near $3.8 million and the average was inflated by a few high-end results to about $5.546 million. Price per square foot averaged around $1,541 in Easton Addition and about $631 in Burlingame Park for that reporting period—but be careful: small sample size distorts averages in Burlingame Park.

It is tempting to read a simple conclusion like “Burlingame Park is 50 percent more expensive than Easton Addition.” The truth is subtler. Burlingame Park’s small number of sales means each expensive home skews the averages. What you can reliably say is that, on an apples-to-apples basis—same lot size, same walkability to downtown—Burlingame Park often commands a premium because of its exclusivity and proximity to Burlingame Avenue.
Walkability, Shops, and the Burlingame Lifestyle Factor
Walkability in Burlingame is shorthand for being walkable to stuff : shops, restaurants, cafes, and groceries. That “stuff” is concentrated along two corridors that matter to buyers in the top Burlingame neighborhoods.
- Burlingame Avenue is a lively retail and dining corridor minutes from many homes in Burlingame Park. It is one of the highest grossing retail strips on the peninsula.
- Broadway runs through or near the southern portion of Easton Addition and offers quieter, high-quality dining and neighborhood retail—think Preston’s Ice Cream, independent bakeries, and small restaurants.
If you prize evening walks to dinner or a 10-minute stroll to coffee, that walkability factor is baked into pricing. Buyers of either of the Burlingame top neighborhoods often pay a premium just to be within striking distance of downtown destinations.
Parks, Tree-Lined Streets, and the Small Details Buyers Love
Burlingame is rightly called a city of trees. Both Easton Addition and Burlingame Park are exceptionally tree-lined, which gives streets a mature, established feel. Parks and playgrounds are also important local assets.
- Burlingame Park has Pershing Park. It is grassy, quiet, kid-friendly, and very much the neighborhood’s front yard.
- Easton Addition abuts Ray Park (the park itself sits in the Ray Park neighborhood but it’s immediately adjacent to the northern edge of Easton). Ray Park includes tennis courts, a dog area, playgrounds, and picnic space.
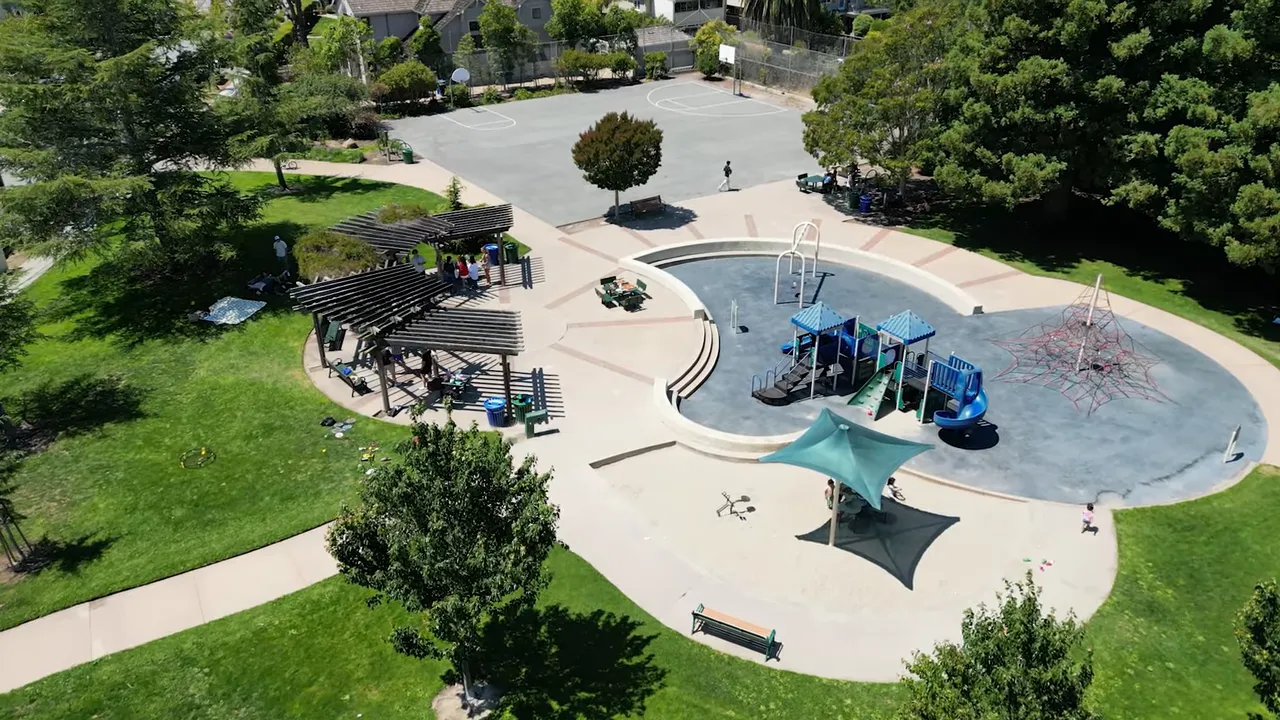
Those everyday amenities are why many buyers choose one of the top Burlingame neighborhoods: morning dog walks among mature oaks, neighborhood soccer pick-up games, and short trips to a favorite café.
Schools and Family Logistics in Burlingame
School boundaries and walkability to elementary schools can change daily routines. Here’s a quick breakdown:
- Burlingame Park generally feeds into Washington Elementary. The school is walkable but crossing El Camino or California Drive makes many families choose to drive a short two to three minutes.
- Easton Addition contains Roosevelt Elementary in the south and Lincoln Elementary in the north. Many children in Easton Addition walk to school; Lincoln neighbors also overlap with Ray Park families. Easton Addition also hosts Our Lady of Angels, a private K–8 option, and Mercy High School is a local all-girls high school in a historic mansion.

For families, the choice between these Burlingame top neighborhoods often comes down to whether you prefer shorter walking routes to school versus slightly larger lots and closer proximity to Burlingame Avenue.
Home Styles, Floor Plans, and Renovation Potential
Both neighborhoods offer older homes with “good bones” and formal floor plans—formal living rooms and dining rooms, central kitchens, and classic layouts. However, these older plans were designed in an era when kitchens were not the social hub they are today. If an open-plan kitchen that flows to the backyard is your priority, expect to pay a premium for either a renovated existing home or a rebuild.
Ranch-style layouts with attached garages are more common in neighborhoods like Mills Estates and Burlingame Village. If you want that ranch footprint, the two top Burlingame neighborhoods may not be ideal unless you specifically find a property with that plan.
Which Burlingame Neighborhood Is Right for You?
Below is a quick checklist that clarifies which neighborhood often fits which buyer.
- Choose Easton Addition if you want a larger pool of homes to choose from, easier teardown/new build options, and more variety in price points within the top-tier market of Burlingame.
- Choose Burlingame Park if you prize exclusivity, slightly larger lots on average, and the short walk to Burlingame Avenue’s shops and restaurants—even if that means less inventory and a smaller number of annual sales.
Both neighborhoods sit among the best choices in Burlingame; deciding between them largely comes down to trade-offs between inventory, rebuild flexibility, and proximity to downtown retail.
Key Terms and Numbers Every Burlingame Buyer Should Know
- Easton Addition: ~1,555 homes, typical lot ~6,000 sq ft, median price ~ $3.68M, higher price per square foot on average.
- Burlingame Park: ~451 homes, larger lots common, very limited annual sales, historic designation affects teardowns and facade preservation.
- Lot value: 6,000 sq ft lots in recent years climbed from low $2 millions to mid-to-high $2 millions, with record sales approaching $2.85M.
Next Steps for Buying a Home in Burlingame
- Walk both neighborhoods on multiple days and at different times—mornings, school pickup, and evenings.
- Decide how important a rebuild option is. If you plan to tear down, Easton Addition generally offers fewer regulatory hurdles.
- Set your search radius around walkability anchors—Burlingame Avenue and Broadway—and prioritize street-level amenities you use daily.
- Prepare for low inventory. In both of the top Burlingame neighborhoods, be patient or be ready to act quickly when the right home comes on market.
Ready to take the next step?
If you're actively house‑hunting in Burlingame—or want a tailored market snapshot for Easton Addition vs. Burlingame Park—I can help. I’ll pull recent comparable sales, set up showings, or prepare a lot‑by‑lot rebuild vs. renovate estimate for any property you’re considering. Call or text: 650‑822‑7088
Tell me which neighborhood you prefer and I’ll send the most relevant sales, active listings, and a no‑obligation action plan to help you move forward.
FAQ
How different are the price points between the Burlingame top neighborhoods?
Price points overlap, but averaged numbers can mislead because Burlingame Park has very few annual sales. Expect Easton Addition to have a broader range—$2.1M to $7.5M in recent examples—while Burlingame Park often shows higher averages because inventory is limited and special properties can skew results.
Can I tear down and rebuild in Burlingame Park?
Not easily. Burlingame Park has a historic designation. Properties may be reviewed and, if deemed historic, require preservation of facades or other restrictions. Easton Addition is generally more permissive for teardown and new construction, subject to the city’s design review rules.
Which neighborhood is more walkable to shops and restaurants?
Both are walkable, but Burlingame Park is a shorter walk to Burlingame Avenue retail. Easton Addition sits closer to Broadway and Ray Park, offering quieter neighborhood retail and excellent restaurants a short stroll away.
How many homes typically sell in each neighborhood per year?
Easton Addition: several dozen sales per year (about 40–56 in recent years). Burlingame Park: very limited, around a dozen to a couple dozen, depending on the year.
Which neighborhood is better for families?
Both are excellent. Easton Addition has more elementary school options within the neighborhood and easy access to Ray Park. Burlingame Park is quieter, very walkable to downtown, and close to Washington Elementary. Your ideal pick depends on desired school walkability versus proximity to downtown amenities.
Is price per square foot the best comparison metric?
Price per square foot is helpful, but it does not tell the whole story. Differences in lot size, walkability, building restrictions, and sample size of transactions all influence real value. Use price per square foot as one input, not the only input.
Final thought
Both Easton Addition and Burlingame Park rank among the most desirable in Burlingame for good reason. Choosing between these two top options means weighing available inventory, the ability to rebuild, and how much you value a short walk to downtown. If you love big trees, solid schools, and an easy stroll to coffee or dinner, either of the Burlingame top neighborhoods could be an excellent fit. The right choice will align with the lifestyle you want and the timeline you have for finding the right property.
If you are actively searching, spend time walking the streets, compare recent closed sales for similar lot sizes, and set reminders for new listings—inventory moves fast and local context matters.