The last decade in San Mateo County real estate has been a story of contrasts: pockets of extraordinary growth—some neighborhoods nearly doubling in value—and other areas that have seen stagnation or declines. Understanding those differences matters whether you are buying, selling, or simply tracking the market. This article breaks down the key drivers behind the winners and losers, how different property types performed, and practical steps you can take with your own home or investment.
Table of Contents
- Overview
- What Drove 103% Growth in Some San Mateo County Neighborhoods?
- Which San Mateo Cities Gained and Which Lost Value?
- How Homes, Townhomes, and Condos Performed in San Mateo County
- San Mateo County: Four-Year Versus Ten-Year Trends
- Why Neighborhood-Level Analysis Matters More Than City Averages
- Practical Advice for San Mateo Buyers and Sellers
- Resources and Next Steps
- FAQ About San Mateo Real Estate
- Final Thoughts
Overview
San Mateo County real estate has not moved uniformly. While some cities posted eye-catching gains—headline figures like 103% growth over a decade in certain micro-markets—other locations lost value or barely kept pace with inflation. These diverging paths reflect differences in supply constraints, local investment, transit access, buyer preference shifts, and the changing economics of commuting and remote work. In practice this means a handful of neighborhoods with tight inventories, strong schools, new transit connections, or focused redevelopment saw intense buyer demand and rapid appreciation, while adjacent blocks with older stock, higher HOA fees, or less convenient commutes experienced much slower growth or even declines.
That unevenness matters for anyone making a move in the county. City-level averages can obscure street-by-street realities that determine what a competitive offer looks like, which renovation projects deliver true value, and where inventory risk is highest. Equally important is distinguishing structural drivers—like land scarcity and long-term infrastructure investments—from short-term forces such as interest-rate swings or pandemic-driven lifestyle changes. Understanding those nuances helps buyers, sellers, and investors set realistic expectations, prioritize improvements, and choose neighborhoods that match their time horizon and goals.
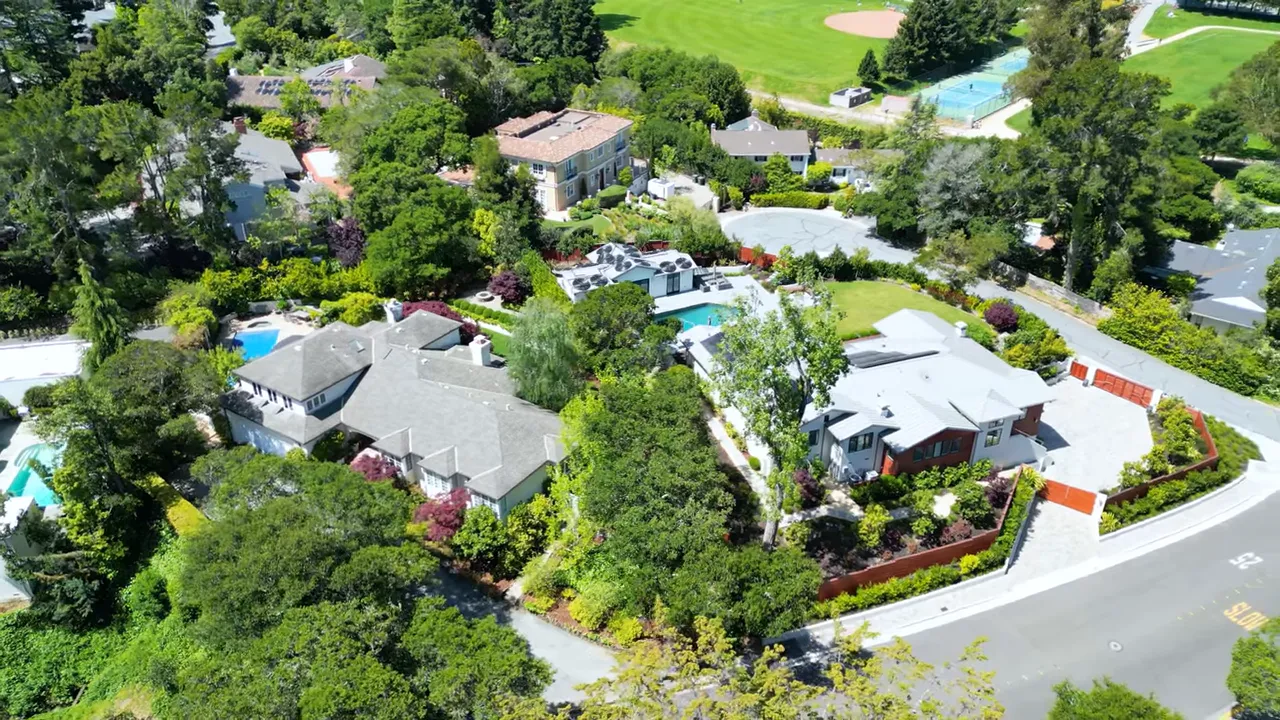
What Drove 103% Growth in Some San Mateo County Neighborhoods?
When you see a number like 103 percent growth over ten years, a few repeating themes usually explain it. Here are the strongest drivers seen across San Mateo County real estate:
- Limited supply and high demand: Neighborhoods with a small number of for-sale homes and consistent buyer interest see outsized appreciation. In a constrained bay-area market, that pressure compounds.
- Proximity to transit and major job centers: Areas near Caltrain stations or major highways that provide easy access to tech hubs typically outperform other locations.
- Local investment and redevelopment: Streets or districts that attracted boutique retail, parks, or school improvements often became more desirable, lifting prices.
- Quality of schools and neighborhood character: Good school districts and streets with attractive architecture remain powerful price catalysts.
- Renovation-led value creation: In neighborhoods with older homes and large lots, buyers who renovate can unlock substantial value—and when many homes get updated, market comps jump.
All of these forces combine differently in each city and even within a single city. That is why a two-block shift can feel like moving to a different market.
Which San Mateo Cities Gained and Which Lost Value?
Rather than pointing to one-size-fits-all winners and losers, think in terms of micro-markets. Within San Mateo County, some cities and neighborhoods showed dramatic appreciation, while others cooled. Typical patterns:
- Strong growth micro-markets — neighborhoods with transit access, walkable downtowns, or recent public investment often led growth charts. These areas attracted both owner-occupiers and investors.
- Stable or slow-growth markets — places with a larger supply of comparably priced housing, or less proximity to transit and amenities, tended to see steadier but slower appreciation.
- Markets that lost value — occasional pockets lost value due to oversupply of similar units, deferred maintenance on older housing stock, or negative local factors—such as undesirable zoning changes or an exodus of renters in certain condo-heavy complexes.
It is important to emphasize that city-level averages can mask dramatic differences between neighborhoods. A single-family block can outperform the city's condo market by a wide margin, and vice versa.
How Homes, Townhomes, and Condos Performed in San Mateo County
Property type matters. Over multi-year cycles, single-family homes, townhomes, and condos behave differently based on supply dynamics and buyer preference.
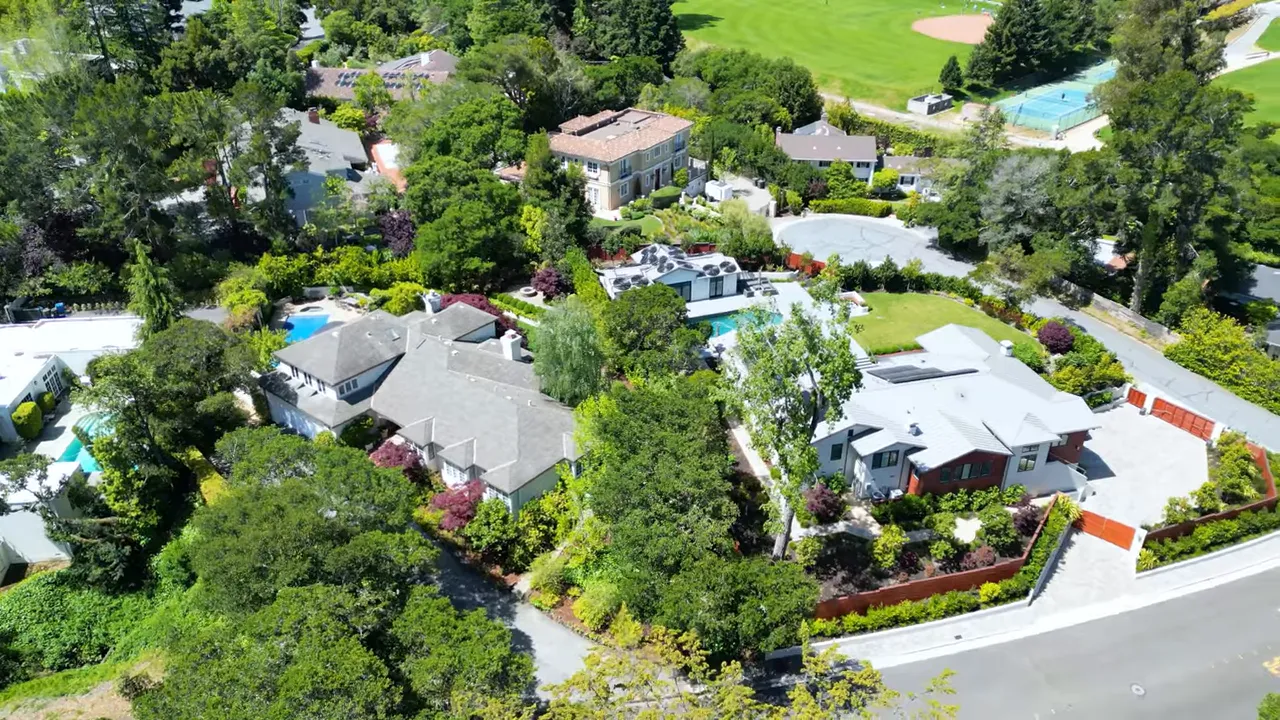
Single-family homes
Single-family homes in San Mateo County saw strong cumulative appreciation over ten years. Reasons:
- Scarcity of land and limited new single-family production.
- High buyer preference for private outdoor space and flexible work-from-home layouts.
- Large lots that allow for meaningful renovations and additions.
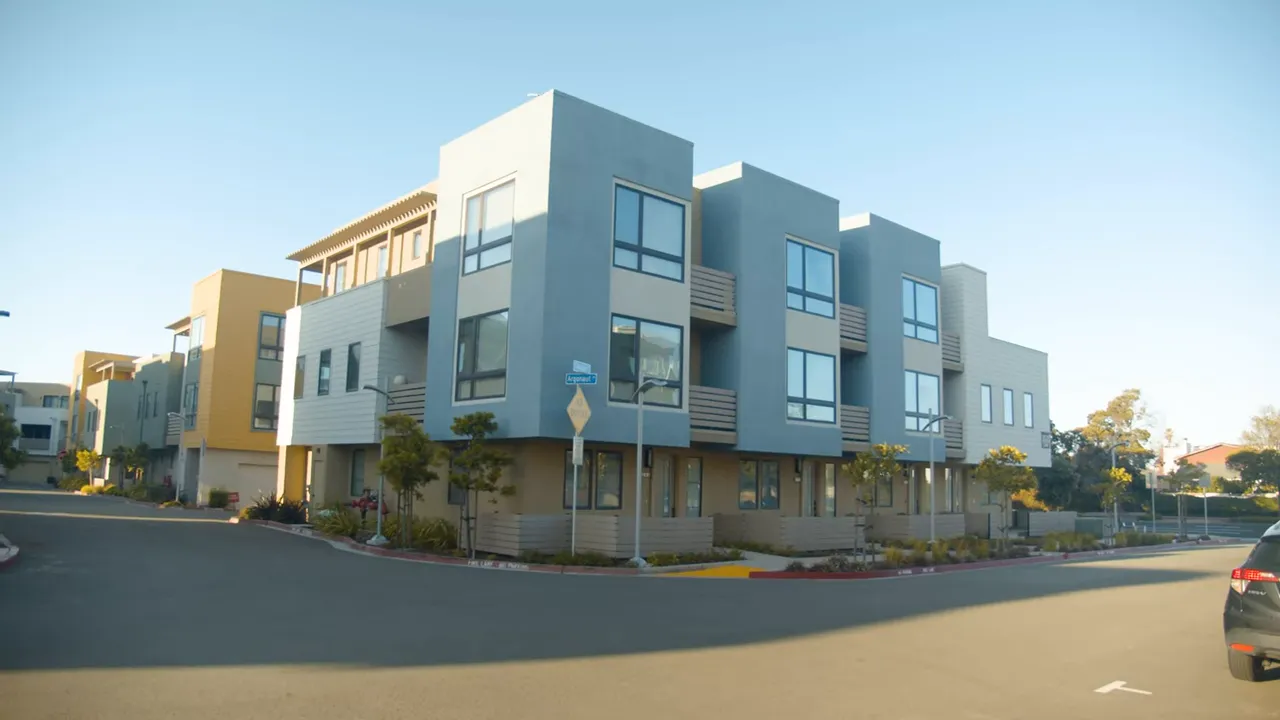
Townhomes
Townhomes frequently served as the middle ground. They offer more space than condos and lower maintenance than single-family homes. In many micro-markets, townhomes delivered solid gains—especially in areas where buyers sought a compromise between price and lifestyle.
Condos
Condos were the most mixed. In desirable, newly built complexes with strong amenities and good management, condos appreciated well. However, older condo projects with deferred maintenance, high HOA fees, or limited parking saw weaker performance. Condos also tend to be more sensitive to mortgage rate swings, which can affect demand more quickly than single-family homes.
San Mateo County: Four-Year Versus Ten-Year Trends
Looking at two timeframes—ten years and the most recent four years—helps separate long-term structural gains from short-term market shifts.
- Ten-year view captures long-term appreciation driven by job growth, persistent supply shortages, and neighborhood investments. This perspective is where the 103 percent headline comes from in the strongest micro-markets.
- Four-year view reveals the impact of interest rates, remote-work patterns, and short-term buyer sentiment. Some areas that surged between 2015 and 2020 cooled after 2020 as buyers reassessed priorities or as rate-sensitive buyers paused.
For sellers, a ten-year perspective shows structural gains and supports larger-picture pricing strategies. For buyers, the four-year view highlights where recent momentum is slowing or accelerating, which helps in timing and negotiation.
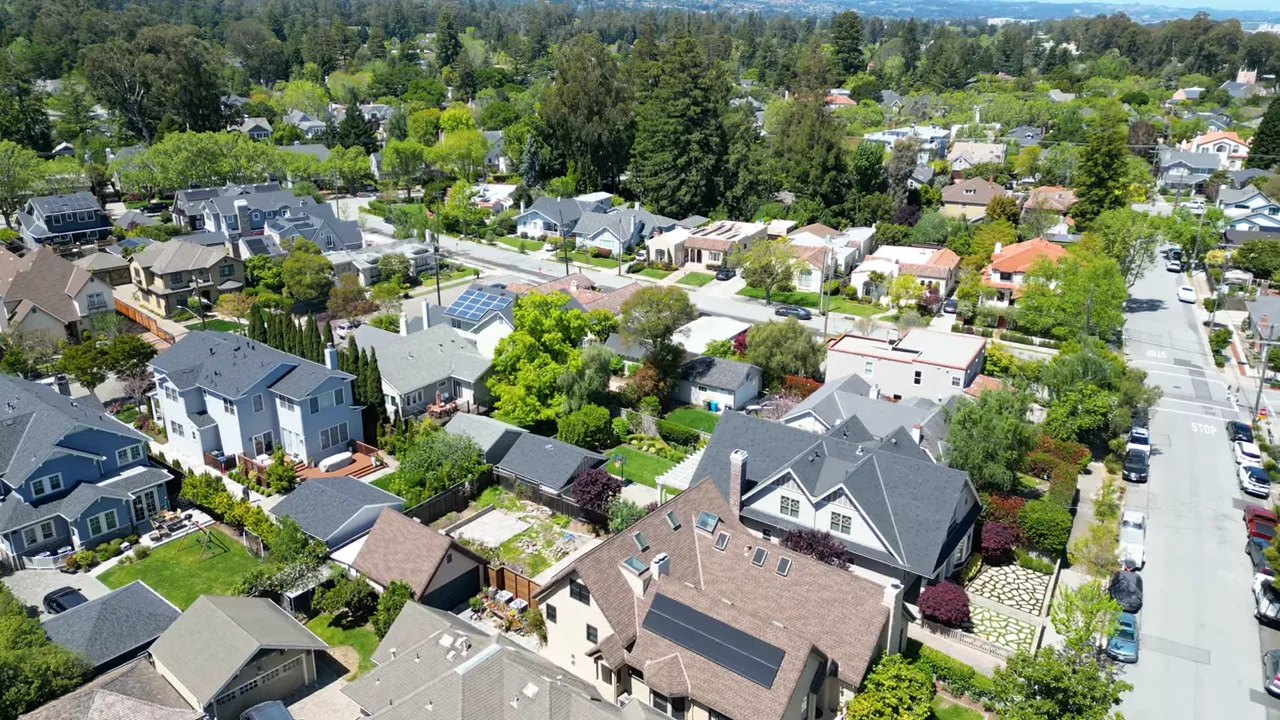
Why Neighborhood-Level Analysis Matters More Than City Averages
City-wide statistics are useful for a quick snapshot, but they obscure the real movements that matter to an individual homeowner or buyer. Micro-market analysis looks at:
- Street-by-street sale prices and days on market.
- Recent renovation trends and how many sellers are updating kitchens and bathrooms.
- Inventory levels for similar properties (active supply vs monthly demand).
- Local developments, school boundaries, and transit projects that are in planning or construction.
When considering a property, pairing city-level trends with neighborhood-level comps helps set realistic expectations and smarter pricing or offer strategies.
Practical Advice for San Mateo Buyers and Sellers
Given the uneven performance across San Mateo County real estate, here are tactical recommendations tailored to different goals.
For buyers
- Match property type to your horizon. If you plan to stay long term, a single-family home in a stable school district often preserves value. If you expect to move in a few years, consider resale liquidity and how quickly that product typically sells in the micro-market.
- Prioritize location over short-term market noise. A well-located property near transit or a strong downtown will likely outperform a similarly priced property without those benefits.
- Factor in renovation costs. In some markets, modest investment in kitchens, bathrooms, or exterior maintenance yields high returns. But account for the carrying costs and timeline.
- Use recent closed sales, not list prices. Closed comps show what buyers actually paid; they are the best guide for a competitive offer.
For sellers
- Price to the neighborhood. Overpricing against local comps tends to increase days on market and can reduce final sale proceeds.
- Invest selectively. High-return improvements are curb appeal, paint, kitchen refresh, and correcting deferred maintenance. Consult a local agent for the best ROI in your micro-market.
- Stage and market the lifestyle. Buyers in San Mateo County buy more than square footage; they buy convenience, schools, and commute options. Make those features visible in marketing materials.
Resources and Next Steps
To act on this data without overcommitting to headline numbers, follow a disciplined approach:
- Compile recent closed sales for properties comparable to yours over the last 90 days.
- Track active inventory and new listings to sense competitive pressure.
- Check local zoning changes, infrastructure projects, and school boundary updates.
- Run renovation scenarios against comparable sales to estimate net value creation.
- Speak with local professionals—appraisers, experienced agents, and property managers—who know the neighborhood nuances.
If you have questions about how these trends affect your specific neighborhood or property, reach out—I’m happy to walk through local comps and options with you. Email hello@burlingameproperties.com or call/text 650-822-7088 to set up a quick, personalized consultation.
FAQ About San Mateo Real Estate
How common was 103 percent growth across San Mateo County real estate?
That level of growth occurred in specific micro-markets rather than countywide. It represents the high end of the distribution—neighborhoods that combined strong demand, limited supply, and local improvements. City averages were generally lower, with many areas seeing more modest but steady gains.
Did condos keep up with single-family homes?
Condos showed mixed performance. In highly amenitized, well-located complexes, appreciation was strong. But older projects with high fees or deferred maintenance lagged. Single-family homes generally had more consistent long-term appreciation due to land scarcity and buyer preferences for space.
How should I interpret short-term slowdowns in some cities?
Short-term slowdowns can reflect higher interest rates, seasonal demand shifts, or a temporary oversupply of similar properties. They do not necessarily indicate a market turning permanently; however, they do mean negotiation leverage can vary and timing matters for both buyers and sellers.
What tools can help me track micro-market performance?
Use a combination of county property records, local MLS reports, and neighborhood-specific dashboards. Pay attention to inventory, median days on market, and price per square foot trends. Local agents who run repeat analyses on the same streets are also valuable.
Is now a good time to buy or sell in San Mateo County?
Whether it is a good time depends on personal circumstances, the specific neighborhood, and property type. Long-term buyers in desirable micro-markets usually benefit from owning in this county, but timing, financing, and individual goals should guide the decision.
Final Thoughts
San Mateo County real estate is a patchwork of strong winners, steady performers, and a few lagging corners. The most useful insights come from looking past headlines and into the specific neighborhoods, property types, and local drivers. Whether you are planning to buy, sell, or hold, focus on micro-market data, realistic renovation returns, and how your timeline aligns with broader market cycles.
If you keep these principles front of mind, you’ll be better equipped to navigate a market where some homes doubled in value while others did not keep pace.
Read More: San Mateo County Homebuyer Tips: How to Navigate a Competitive Market